import weave
from weave.flow import leaderboard
from weave.trace.ref_util import get_ref
import asyncio
client = weave.init("leaderboard-demo")
dataset = [
{
"input": "Weave is a tool for building interactive LLM apps. It offers observability, trace inspection, and versioning.",
"target": "Weave helps developers build and observe LLM applications."
},
{
"input": "The OpenAI GPT-4o model can process text, audio, and vision inputs, making it a multimodal powerhouse.",
"target": "GPT-4o is a multimodal model for text, audio, and images."
},
{
"input": "The W&B team recently added native support for agents and evaluations in Weave.",
"target": "W&B added agents and evals to Weave."
}
]
@weave.op
def jaccard_similarity(target: str, output: str) -> float:
target_tokens = set(target.lower().split())
output_tokens = set(output.lower().split())
intersection = len(target_tokens & output_tokens)
union = len(target_tokens | output_tokens)
return intersection / union if union else 0.0
evaluation = weave.Evaluation(
name="Summarization Quality",
dataset=dataset,
scorers=[jaccard_similarity],
)
@weave.op
def model_vanilla(input: str) -> str:
return input[:50]
@weave.op
def model_humanlike(input: str) -> str:
if "Weave" in input:
return "Weave helps developers build and observe LLM applications."
elif "GPT-4o" in input:
return "GPT-4o supports text, audio, and vision input."
else:
return "W&B added agent support to Weave."
@weave.op
def model_messy(input: str) -> str:
return "Summarizer summarize models model input text LLMs."
 async def run_all():
     await evaluation.evaluate(model_vanilla)
     await evaluation.evaluate(model_humanlike)
     await evaluation.evaluate(model_messy)

asyncio.run(run_all())
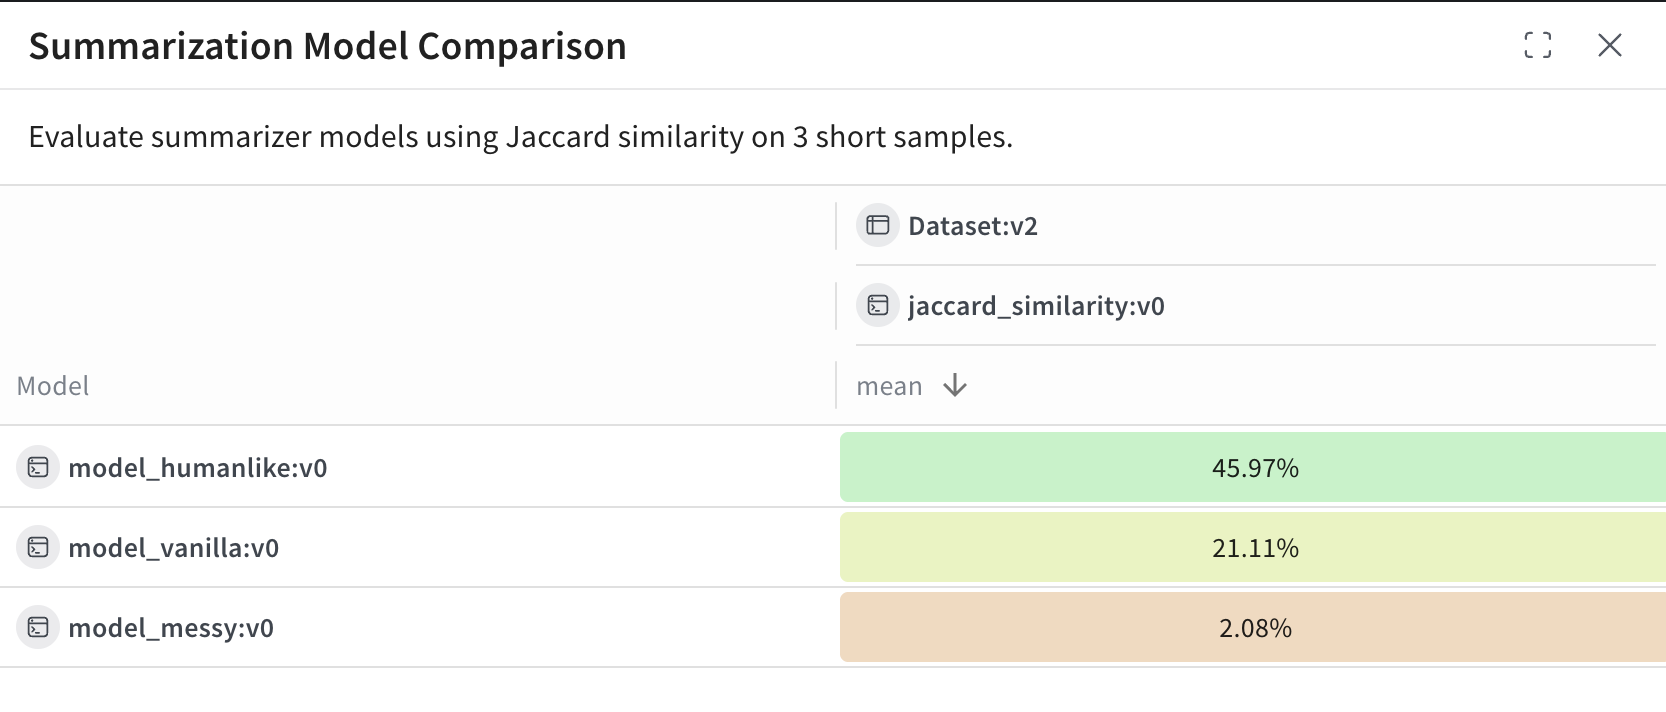
spec = leaderboard.Leaderboard(
name="Summarization Model Comparison",
description="Evaluate summarizer models using Jaccard similarity on 3 short samples.",
columns=[
leaderboard.LeaderboardColumn(
evaluation_object_ref=get_ref(evaluation).uri(),
scorer_name="jaccard_similarity",
summary_metric_path="mean",
)
]
)
weave.publish(spec)
results = leaderboard.get_leaderboard_results(spec, client)
print(results)
 For this example:

